Posts under category statistics homework help

Submit this project to the proctor at the time you take Test 3.

When the problem involves hypothesis testing, use the following structure for written reports.

Hypothesis testing steps

• Step 1: State the hypotheses.
• Step 2: Summarize the data for your readers.
• Step 3: Give the value of the test statistic and the p-value.
• Step 4: Use the p-value to draw a conclusion. State the conclusion in statistical
terms: Reject Ho in favor of Ha, or retain Ho (fail to reject Ho).
• Step 5: State the conclusion in layman terms and in context of the application. Use the
p-value to state the strength of the evidence.
When a significance level is not given, then use the following guidelines and language associated
with p-value. Note that the lower the p-values, the stronger the evidence against Ho and in
favor of Ha. We go from insufficient evidence, to some evidence, to fairly strong evidence, to
strong evidence, to very strong evidence.
• p-value > .10
retain Ho – there is insufficient evidence to reject Ho in favor of Ha
• .05 < p-value ≤ .10
gray area -- decision to reject Ho or retain Ho is up to the investigators – there is some
evidence against Ho and in support of Ha
• .01 < p-value ≤ .05
reject Ho in favor of Ha – there is fairly strong evidence against Ho and in favor of Ha
• .001 < p-value ≤ .01
reject Ho in favor of Ha – there is strong evidence against Ho and in favor of Ha
• p-value ≤ .001
reject Ho in favor of Ha – there is very strong evidence against Ho and in favor of Ha
Use your TI-83/TI-84 calculator for all of these problems. You will not need any tables.
Use the Sample Test 3 Questions—Answer Key (posted in Canvas) as an example of what my
expectations are.

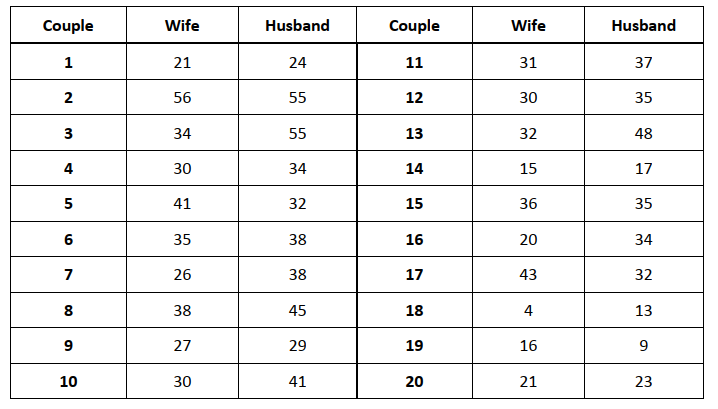
  1. A sociologist suspects that, for married couples with young children, the husbands watch more TV
    than the wives. Twenty married couples are randomly selected and their weekly viewing times, in
    hours, are recorded in the table below. Assume the population of differences between husband’s
    and wife’s TV time is mound-shaped and symmetrical.
    a) Do the sample results provide sufficient evidence to support the sociologist’s claim? Perform a
    hypothesis test to find out.
    b) If there is sufficient evidence to support the sociologist’s claim, estimate how much more TV the
    husbands watch, on average, with a 95% confidence interval. Interpret.
2023-04-04T07:33:48.png

  1. The data below show the sugar content (as a percentage of weight) of several national brands of
    children’s and adults’ cereals. Assume the distributions of sugar content in both children’s cereals
    and adults’ cereals are mound-shaped and symmetrical.
    a) Does the sample data provide sufficient evidence to conclude that the sugar content in
    children’s cereals is higher than that in adults’ cereals, on average? Perform a hypothesis test to
    find out.
    b) If you conclude that children’s cereals have more sugar than adults’ cereals, estimate how much
    more with a 95% confidence interval for the difference in mean sugar content. Interpret.
    Children’s cereals: 40.3, 55, 45.7, 43.3, 50.3, 45.9, 53.5, 43, 44.2, 44, 47.4, 44, 33.6, 55.1, 48.8,
    50.4, 37.8, 60.3, 46.6
    Adults’ cereals: 20, 30.2, 2.2, 7.5, 4.4, 22.2, 16.6, 14.5, 21.4, 3.3, 6.6, 7.8, 10.6, 16.2, 14.5, 4.1,
    15.8, 4.1, 2.4, 3.5, 8.5, 10, 1, 4.4, 1.3, 8.1, 4.7, 18.4
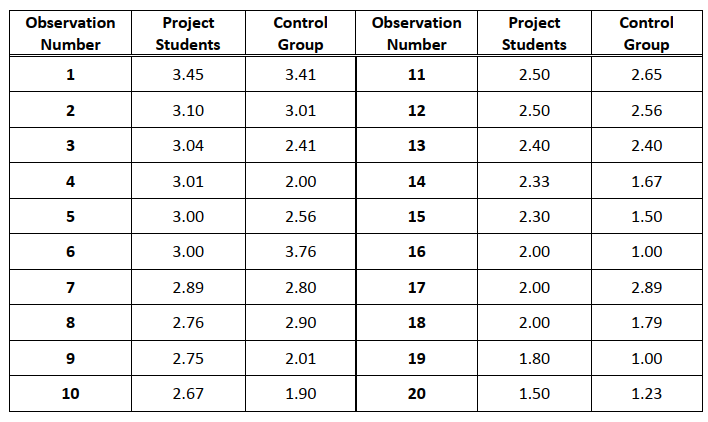
  2. A randomly selected sample of entering college freshmen has participated in a special program to
    enhance their academic abilities, and their GPAs at the end of one year have been recorded. A
    group of 20 students from the same class who did not participate in the program has been selected
    as a control group, and they have been matched with the experimental group by gender, age, highschool class rank, ACT scores, and declared major. The results (GPAs) are presented below. Assume
    the population of differences between the project student GPA and the control group student GPA
    is mound-shaped and symmetrical.
    a) Can the program claim that it was successful? Carry out a hypothesis test to find out.
    b) If you conclude that the program was successful, make a judgment regarding the size of the
    effect of program participation on student GPAs by constructing a 95% confidence interval.
    Interpret your confidence interval.
2023-04-04T07:34:52.png

  1. Michelle Sayther is a fashion design artist who designs the display windows in front of a large
    clothing store in New York City. Electronic counters at the entrances total the number of people
    entering the store each business day. Before Michelle was hired by the store, the mean number of
    people entering the store each day was 3218. Management would like to investigate whether this
    number has changed since Michelle has started working. A random sample of 42 business days after
    Michelle began work gave an average of 𝑋𝑋� = 3392 people entering the store each day. The sample
    standard deviation was s = 287 people. Assume the population of daily number of people entering
    the store is mound-shaped and symmetrical.
    a) Perform a hypothesis test to decide if the average number of people entering the store each day
    since Michelle was hired is different from what it was before Michelle was hired.
    b) If you find that the average number of people entering the store each day since Michelle was
    hired is different from what it was before Michelle was hired, estimate the average number of
    people entering the store each day since Michelle was hired with a 95% confidence interval and
    interpret. (Has the number of people entering the store each day increased or decreased since
    Michelle was hired, and by how much has it increased or decreased?)
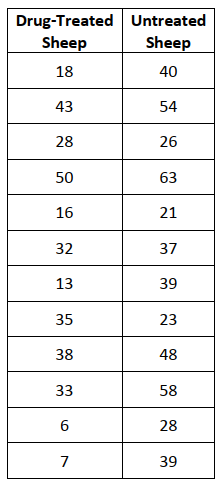
  2. An experiment was conducted to evaluate the effectiveness of a treatment for tapeworm in the
    stomachs of sheep. A random sample of 24 worm-infected lambs of approximately the same age
    and health was randomly divided into two groups. Twelve of the lambs were injected with the drug
    and the remaining twelve were left untreated. After a 6-month period, the lambs were slaughtered
    and the following worm counts were recorded. Assume the distribution of worm counts of drugtreated sheep is mound-shaped and symmetrical. Assume the distribution of worm counts of
    untreated sheep is also mound-shaped and symmetrical.
    c) Does the sample data provide sufficient evidence to conclude that the treatment is effective in
    reducing the occurrence of tapeworm in sheep? Perform a test of significance to find out.
    d) If you conclude that the treatment is effective, estimate the average reduction in tapeworm
    count with a 95% confidence interval. Interpret.
2023-04-04T07:36:10.png

  1. In each of the problems above, #1- #5, an assumption of normality is made about the distribution of
    the population(s) from which the sample data is obtained. For each of #1 - #5, provide the page
    number in the e-book where the assumption is described by the author. You will be citing page
    numbers from Sections 9.2, 10.1, and 10.2.
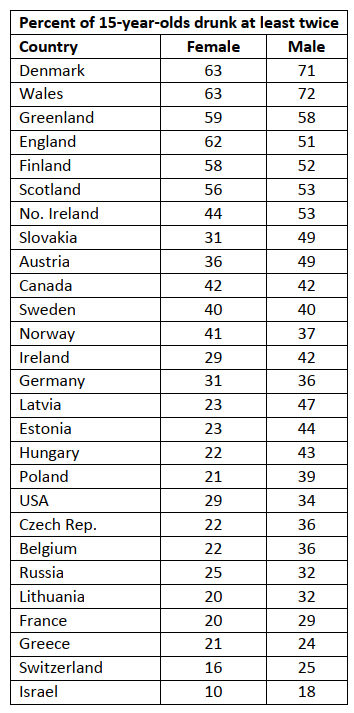
  2. A study of the health behavior of school-aged children asked a sample of 15-year-olds in several
    different countries if they had been drunk at least twice. The results are shown in the table, by
    gender. (Health and Health Behavior Among Young People. Copenhagen. World Health
    Organization, 2000)
    a) Perform a hypothesis test to determine if there is a gender effect. That is, is there a difference
    in the average percent of 15-year-old males who have been drunk at least twice and the average
    percent of 15-year-old females who have been drunk at least twice? Assume the distributions
    for both males and females are mound-shaped and symmetrical.
    b) If there is sufficient evidence that there is a difference between average percent of 15-year-old
    males who have been drunk at least twice and the average percent of 15-year-old females who
    have been drunk at least twice, estimate the difference with a 95% confidence interval and
    interpret your interval.
2023-04-04T07:37:06.png

Quantitative project reasoning solutions. The following solutions have been provided to you by MyMathLab statistics experts The solutions were provided under the MyMathLab answers statistics help services.

Data Analysis Using Excel

For each of the following problems, save your work to a .r file. Name your files like
<.First Name>_HW3.
So my file for problem 2 would be Hendrix_Jeremy_HW3_2.r
Upload your five files to DropBox.

I have provided you with an Excel spreadsheet called Last_FM_data_shuffled.xlsx. It contains the log of all the music I have listened to on my phone since I began using the Last.fm website. As the name implies however, I have shuffled the entries so that they are no longer in chronological order. There is a header row at the top of the spreadsheet, and there are four columns of data: Band, Album, Song, and Date.

  1. Assuming you are not using packages that let you read from Excel, what must you do first in order to prepare this data to import to an R dataframe? What command will you use to import it?
    For this problem, submit a .r file where the first line is a comment telling me what you have to do, and the second line is the R command to import the data. Remember that # is the comment character.
  2. What is a single R command that can be used to count how many different bands are represented in the data file?
  3. Write an R script that will sort the data back into chronological order and store it in a new dataframe.
  4. Recall that the table() function can be used to quickly summarize data. As an example, assuming I have attached the dataframe with the song data, I can type
head(table(Song))

And get the following output

Song
(Song For My) Sugar Spun Sister 1901 45

                          2                        1               2

     50 Ways to Say Goodbye     6th Avenue Heartache      8:02:00 PM 
                          1                        2               1 

Each song title appears as a column heading and the number underneath it represents the number of time the song appears in the Song column of the dataframe.
Using this, what is the R command to determine the name of the song that has been played the most times? What is the R command to determine how many times that song has been played?

  1. Using R, determine the average number of songs I listened to per day over the time period in the dataset.

Dataset search and Analysis using R

For this, you need to find a dataset that contains at least 100 observations. There are a variety of repositories on the internet that contain large data sets. If you’re totally stuck, try https://data.world/

Once you have identified your dataset, determine an interesting plot you can make from it. This can be any kind of chart you want (scatter, line, pie, etc) and can be built using base R or ggplot2 as you prefer.

Now build an R Markdown document with parameters that can be used to generate a report from your dataset and can be customized by setting the parameters. This will follow the same basic approach for the beach water quality example.

So for instance, the parameters might be a start date and an end date and the plot would be limited to that subset. Or they might be a state or a region that is in the data file and plots data for that state.

Guidelines for the Empirical Analysis

Analysis in R or STATA

  1. Plot the cross-sectional average of deposits/assets and Non-Deposit Debt/assets across time.
    You can calculate Non-Deposit Debt = Assets – Deposits – Equity. How have the averages
    evolved? How would you interpret your results?
  2. Run OLS regressions of quarterly loan growth on non-deposit debt/assets (one quarter lagged value) controlling for bank size (i.e. one quarter lagged natural logarithm of total asset) and
    profitability (i.e. one quarter lagged return on assets) for the sub-sample of your data during the
    financial crisis (i.e. 2008Q1 – 2010Q1). You should have Bank and Time fixed effects in your
    regression. What is the sign and magnitude of the co-efficient on non-deposit debt/assets? Is the
    coefficient significant? How will you interpret the co-efficient? Justify your findings.
  3. Compute two measures / (ex-post) proxies for bank risk
    a. Risk weighted asset divided by total assets
    b. Non-performing loans divided by total loans
  4. Plot the cross-sectional average of the above two measures across time. How have the averages
    evolved across years? How would you interpret your results?
  5. Run OLS regressions of the two ex-post measures of bank risk on equity over assets (one
    quarter lagged values). Control for bank size (i.e. one quarter lagged natural logarithm of total
    asset) and profitability (i.e. one quarter lagged return on assets) on the entire sample. You
    should have Bank and Time fixed effects in your regression. What is the sign and magnitude of
    the co-efficient on equity/assets? Is the coefficient significant? How will you interpret the coefficient? Justify your findings.
    Note: Make sure you winsorize all your variables (per quarter at the 1st and 99th percentile) to
    remove outliers.

Solve using Excel & Minitab (Do not use formula)

The following questions are from probability and statistics questions. The questions were previously solved by our statistic experts using MINITAB; in case you are a student looking for help with similar questions, then you can contact us so that we may provide similar services under our do MyMathLab homework so that we can provide you similar solutions, or solutions with similar questions, either using Excel data analysis tools , or by using the latest Minitab application software. The solutions to each question are attached for you confirmation.

  1. A die is tossed 3 times. What is the probability of
    (a) No fives turning up?
    (b) 1 five?
    (c) 3 fives?
    Probability Solution for Question 1
    Outut for Question 1:
    Probability Density Function

Binomial with n = 3 and p = 0.17

x P( X = x )
0 0.571787
Probability Density Function
Binomial with n = 3 and p = 0.17
x P( X = x )
1 0.351339
Probability Density Function
Binomial with n = 3 and p = 0.17
x P( X = x )
3 0.004913
  1. Hospital records show that of patients suffering from a certain disease, 75% die of it. What is the probability that of 6 randomly selected patients, 4 will recover?

    Question 2
    probability of 4 recoveries
    Probability Density Function
    Binomial with n = 6 and p = 0.25
    x P( X = x )
    4 0.0329590
  2. The ratio of boys to girls at birth in Singapore is quite high at 1.09:1.
    What proportion of Singapore families with exactly 6 children will have at least 3 boys? (Ignore the probability of multiple births.)
Question 3
Probability of atleast 3 Boys
Cumulative Distribution Function
Binomial with n = 6 and p = 0.5219
x P( X ≤ x )
2 0.303638
P(x <= 3) = 1-0.3036 = 0.6957
  1. A manufacturer of metal pistons finds that on the average, 12% of his pistons are rejected because they are either oversize or undersize. What is the probability that a batch of 10 pistons will contain
    (a) no more than 2 rejects? (b) at least 2 rejects?

    Question 4

    a) Probability of not more than 2
    Cumulative Distribution Function
    Binomial with n = 10 and p = 0.12
    x P( X ≤ x )
    2 0.891318

b) probability of at least 2 = 1-P(x <= 1)
Cumulative Distribution Function
Binomial with n = 10 and p = 0.12
x P( X ≤ x )
1 0.658275
p(x>=2) = 1-0.6583 = 0.3417
  1. A die is rolled 240 times. Find the mean, variance and standard deviation for the number of 3s that will be rolled?
  2. If there are 200 typographical errors randomly distributed in a 500 page manuscript, find the probability that a given page contains exactly 3 errors.

    Question 6

    exactly 3 errors.
    Results for: Q6.MTW
    Probability Density Function
    Poisson with mean = 0.4
    x P( X = x )
    3 0.0071501

  3. A sales form receives on the average of 3 calls per hour on its toll-free number. For any given hour, find the probability that it will receive a. At most 3 calls; b. At least 3 calls; and c. Five or more calls.

Question 7

At most 3 calls
P (X <= 3)
Cumulative Distribution Function
Poisson with mean = 3
x P( X ≤ x )
3 0.647232
b At Least 3 Calls = 1-P(X<=2)
Cumulative Distribution Function
Poisson with mean = 3
x P( X ≤ x )
2 0.423190
p(X>=3) = 1-0.42319 = 0.5768
c Probability of five or More calls
= 1- p(X<=4)
Cumulative Distribution Function
Poisson with mean = 3
x P( X ≤ x )
4 0.815263
p(x>=5) = 1-0.815263 = 0.1847

  1. A life insurance salesman sells on the average 3 life insurance policies per week. Calculate the probability that in a given week he will sell
    a. Some policies
    b. 2 or more policies but less than 5 policies.
    c. Assuming that there are 5 working days per week, what is the probability that in a given day he will sell one policy?

A solution to this probability question has been provided by our experts, you may contact us if you need help with this question.

  1. Twenty sheets of aluminum alloy were examined for surface flaws. The frequency of the number of sheets with a given number of flaws per sheet was as follows:

Number of flaws
Frequency
0 4
1 3
2 5
3 2
4 4
5 1
6 1
What is the probability of finding a sheet chosen at random which contains 3 or more surface flaws?

  1. Find the area right of z=1.11

You can solve this question using either Excel data analysis tools, or Minitab, when you choose to use Excel, then use the function =NORM.S.DIST(1.11,TRUE) = 0.8665, which gives you the area to the left, to find the area to the right = 1-0.8665 = 0.1335

  1. Find the area left of z = -1.93
    You can also apply similar tactics as above to solve this question.
  2. Find the area between -/+ 1, 2, 3, 4, 5, 6, standard deviations.
  1. Find the z value such that the area under the normal distribution curve between 0 and the z value is 0.2123
  2. A study on recycling shows that in a certain city, each household accumulates an average of 14 pounds of newspaper each month to be recycled. The standard deviation is 2 pounds. If a household is selected at random, find the probability it will accumulate the following:
    a. Between 13 and 17 pounds of newspaper for a month.
    b. More than 16.2 pounds of newspaper for one month.

This question has been solved in many of our questions under our myMathlab homework help services.

  1. A standardized achievement test has a mean of 50 and a standard deviation of 10. The scores are normally distributed. If the test is administered to 800 selected people, approximately how many will score between 48 and 62?