Posts under category statistics homework help

Data Analytics using Regression Model

Suppose that a resource allocation decision is being faced whereby one must decide how many computer servers a service facility should purchase to optimize the firm’s costs of running the facility. The more servers they have, the less workers are needed. Too many servers will result in over-capacity and waste resources. The firm’s predictive analytics effort has shown a growth trend. A new facility is called for if costs can be minimized. The firm has a history of setting up large and small service facilities and has collected the 40 data points. Let’s consider the following linear model, and estimate that using the data.

Linear Model 2023-03-22T06:18:23.png

Where COST = the total cost to maintain a service facility.

         X  = the number of servers installed in each service facility

Using the Excel data, copy and paste to MINITAB answer the following questions.

1) Estimate the model and copy and paste the results and explain the meanings of the estimated coefficients.
2) Find TSS, RSS, ESS and R square, and carefully explain their meanings.
3) Using t test, prove/disprove if the estimated coefficient b is significant
4) What are the elasticity of server on total cost if you have 20 servers, or 40 servers?

5) Let’s consider the following log linear model
2023-03-22T06:19:46.png

Explain the coefficient of b and find the elasticity of number of server on the total cost.

6) Linear and Nonlinear Polynomial Models (1 point each)

2023-03-22T06:20:31.png
2023-03-22T06:20:49.png
2023-03-22T06:21:07.png

a. Estimate the model and copy and paste the results and perform the F test for each model
b. Let’s compare the two models, the Linear vs. Nonlinear models. In terms of goodness-to-fit, which one fits better? Carefully explain.
c. According to each model, what are the total cost to maintain the facility if you want install 10, 20, 50 servers?
d. Choose the best model from the regression model in terms of goodness-to-fit, and find the number of servers to minimize the total cost of the service facility.

II. Single Family House Sales in Chicago
We obtain a house sales data from the local Multiple Listing Service (MLS) who provides the up-to-date real estate market listing prices. We obtain the following variables from the properties listed in Chicago in 2015.
BEDROOM : Number of Bedroom
BATHROOM : Number of Bathroom
SQFT : Square Feet of Living Area
GARAGE : Number of Cars in Garage
AGEBLD : Age of Building
FIREPLACE : Number of Fireplace
ZIP : Zip Code
PRICE : Listing Price

  1. Find the descriptive statistics of Listing Price (PRICE) for two zip codes separately, and compare their central tendency, and variance using the following hypothesis tests: (1 points each)
  2. Simple Regression Model (Estimate separate model for each zip code)
    Let’s consider the following simple regression model:
    2023-03-22T06:22:21.png
    1) Estimate the simple regression model, and copy and paste the results from Minitab Regression output from Minitab and explain the meaning of coefficients from each model. (1 point)

2) Using the simple regression output find the following statistics. (0.5 point each)
) Estimate the simple regression model, and copy and paste the results from Minitab Regression output from Minitab and explain the meaning of coefficients from each model. (1 point)

2) Using the simple regression output find the following statistics. (0.5 point each)

Statistics ZIP CODE 1 = ZIP CODE2 =
a. Estimated intercept
b. Estimated slope coefficient
c. Total Sum of Square (TSS)
d. Regression Sum of Square (RSS)
e. Error Sum of Square (ESS)
f. R2
g. Adjusted R2
h. Variance and standard error of b1
i. Correlation Coefficient between listing price (PRICE) and square feet (SQFT)
j. Variance of et

  1. Nonlinear Model (Estimate separate model for each zip code, 1 point each)
    Let’s consider the following log transformed model.

1) Estimate the model and copy and paste the results, and explain the meanings of the estimated slope coefficients from each regression model.

2) Compare and explain the elasticity of square feet to price between two zip codes, which is

  1. Multiple Regression Model (Estimate separate model for each zip code, 1 points each)

1) Estimate the model using Minitab, and copy and paste the results.
2) Explain the meanings of the estimated coefficients.
3) Perform the t tests to find which variables are significant. List all significant variables at 5% and 10% significance levels.
4) Perform the F test for the each regression model, explain your verdict from the test.
5) Let’s compare the simple regression and the multiple regression models for each zip code. Carefully explain which is better.

6) Challenging model (3 points)
Now let’s find the best model to explain the listing price using the given variables. Any combination or any different functional forms are allowed. Find the best possible model. After deciding your final model, justify why your model is better than the other models.
Lesson Chapter 5 Review Questions

Qn1. Charity is planting trees along her driveway, and she has 6 pine trees and 6 willows to plant in one row. What is the probability that she randomly plants the trees so that all 6 pine trees are next to each other and all 6 willows are next to each other? Express your answer as a fraction or a decimal number rounded to four decimal places.
Q2. A person rolls a standard six-sided die 12 times. In how many ways can he get 6 fours, 5 ones, and 1 two?

Qn3. A card is drawn from a standard deck of 52 playing cards. What is the probability that the card will be a heart and not a seven? Express your answer as a fraction or a decimal number rounded to four decimal places.
Qn4. You are going to play mini golf. A ball machine that contains 21 green golf balls, 18 red golf balls, 23 blue golf balls, and 17 yellow golf balls, randomly gives you your ball. What is the probability that you end up with a blue golf ball? Express your answer as a simplified fraction or a decimal rounded to four decimal places.
Qn6.
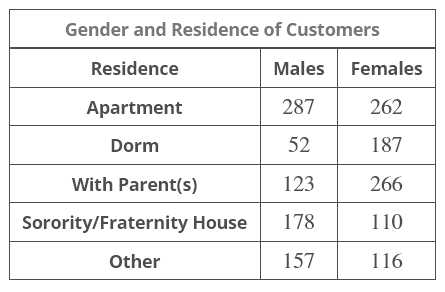
A newspaper company classifies its customers by gender and location of residence. The research department has gathered data from a random sample of 1738
customers. The data is summarized in the table below.

Probability Distribution Table

statistics probability distribution table.png

What is the probability that a customer is female? Express your answer as a fraction or a decimal number rounded to four decimal places.

Qn7. A coin is tossed 3 times. What is the probability that the number of tails obtained will be 1? Express your answer as a fraction or a decimal number rounded to four decimal places.
Qn8. f a coin is tossed 5 times, and then a standard six-sided die is rolled 4 times, and finally a group of two cards are drawn from a standard deck of 52 cards without replacement, how many different outcomes are possible?

If a coin is tossed 5 times, and then a standard six-sided die is rolled 4 times, and finally a group of two cards are drawn from a standard deck of 52

cards without replacement, how many different outcomes are possible?

You can also solve this using technology.
Use The Fundamental Principle of Counting with the Combination Rule.
The experiments or tasks in this problem can be grouped into three basic types of activities, namely, tossing a coin 5
times, rolling a standard six-sided die 4
times, and drawing two cards from a deck of cards without replacement. To obtain the solution to the problem, the number of possible outcomes for each task is computed and then the Fundamental Principle of Counting is applied to the three tasks.
There are 25
outcomes possible when tossing a coin 5 times, 64 outcomes possible when rolling a standard six-sided die 4 times, and C252
outcomes possible when drawing two cards from a deck of cards without replacement. Applying the Fundamental Principle of Counting to these three tasks, we see that the total number of different outcomes possible is
25⋅64⋅C252=32⋅1296⋅1326=54991872
.Qn9.
6 cards are drawn from a standard deck without replacement. What is the probability that at least one of the cards drawn is a black card? Express your answer as a fraction or a decimal number rounded to four decimal places.
Qn11. In a history class there are 8 history majors and 8 non-history majors. 4 students are randomly selected to present a topic. What is the probability that at least 2 of the 4 students selected are non-history majors? Express your answer as a fraction or a decimal number rounded to four decimal places.
Qn12.
Jill is ordering pizza at a restaurant, and the server tells her that she can have up to three toppings: black olives, chicken, and spinach. Since she cannot decide how many of the toppings she wants, she tells the server to surprise her. If the server randomly chooses which toppings to add, what is the probability that Jill gets just spinach? Express your answer as a fraction or a decimal number rounded to four decimal places.

Qn13.
There are 77 students in a history class. The instructor must choose two students at random.
Academic Year History majors non-History majors
Freshmen 13 5
Sophomores 2 9
Juniors 12 12
Seniors 14 10
What is the probability that a junior non-History major and then another junior non-History major are chosen at random? Express your answer as a fraction or a decimal number rounded to four decimal places.

Qn14.
Customer account "numbers" for a certain company consist of 3 letters followed by 5 numbers.
Step 1 of 2 : How many different account numbers are possible if repetitions of letters and digits are allowed?
Qn15.
A coin is tossed 6 times. What is the probability that the number of heads obtained will be between 4 and 6 inclusive? Express your answer as a fraction or a decimal number rounded to four decimal places.
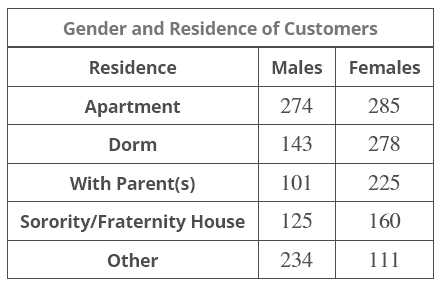
Qn16. A mail order company classifies its customers by gender and location of residence. The research department has gathered data from a random sample of 1936 customers. The data is summarized in the table below.
gender and residence of table.png

What is the probability that a customer lives in a dorm? Express your answer as a fraction or a decimal number rounded to four decimal places.

Qn18. A bag contains 9 red, 8 orange, and 7 green jellybeans. What is the probability of reaching into the bag and randomly withdrawing 16 jellybeans such that the number of red ones is 5, the number of orange ones is 7, and the number of green ones is 4? Express your answer as a fraction or a decimal number rounded to four decimal places.

Qn19.
Larissa is ordering apple pie at a restaurant, and the server tells her that she can have up to four toppings: walnuts, pecans, whipped cream, and caramel. Since she cannot decide how many of the toppings she wants, she tells the server to surprise her. If the server randomly chooses which toppings to add, what is the probability that Larissa gets just walnuts and pecans? Express your answer as a fraction or a decimal number rounded to four decimal places.

Lesson Review question Chapter 7 Hawkeslearning - MyMathLab Questions and Answers

Qn1. Trucks in a delivery fleet travel a mean of 120 miles per day with a standard deviation of 19 miles per day. The mileage per day is distributed normally. Find the probability that a truck drives less than 146 miles in a day. Round your answer to four decimal places.
Answer: - If you would like to look up the value in a table, select the table you want to view, then either click the cell at the intersection of the row and column or use the arrow keys to find the appropriate cell in the table and select it using the Space key.

Qn2. Find the value of z such that 0.13 of the area lies to the left of z. Round your answer to two decimal places.

Qn3. Find the value of z such that 0.03 of the area lies to the right of z. Round your answer to two decimal places.

Qn4. Calculate the standard score of the given X value, X=89.7, where μ=88.2 and σ=89.4 and indicate on the curve where z will be located. Round the standard score to two decimal places.

Qn5. Consider the probability that no fewer than 75 out of 109 students will not graduate on time. Assume the probability that a given student will not graduate on time is 98% .Specify whether the normal curve can be used as an approximation to the binomial probability by verifying the necessary conditions.

Qn6. Find the area under the standard normal curve between z=−0.75 and z=1.83. Round your answer to four decimal places, if necessary.

Qn7. Consider the probability that greater than 99 out of 159 flights will be on-time. Assume the probability that a given flight will be on-time is 61%. Approximate the probability using the normal distribution. Round your answer to four decimal places.

Qn8. The Arc Electronic Company had an income of 54 million dollars last year. Suppose the mean income of firms in the same industry as Arc for a year is 40 million dollars with a standard deviation of 9 million dollars. If incomes for this industry are distributed normally, what is the probability that a randomly selected firm will earn more than Arc did last year? Round your answer to four decimal places.

Qn9. Find the value of z such that 0.9722 of the area lies between −z and z. Round your answer to two decimal places.

Qn10. A soft drink machine outputs a mean of 28 ounces per cup. The machine's output is normally distributed with a standard deviation of 2 ounces. What is the probability of filling a cup between 30 and 31 ounces? Round your answer to four decimal places.

Qn11. Consider the probability that fewer than 38 out of 542 computers will crash in a day.
Choose the best description of the area under the normal curve that would be used to approximate binomial probability.

Qn12. A psychology professor assigns letter grades on a test according to the following scheme.
A: Top 13% of scores
B: Scores below the top 13% and above the bottom 57%
C: Scores below the top 43% and above the bottom 22%
D: Scores below the top 78% and above the bottom 8%
F: Bottom 8% of scores
Scores on the test are normally distributed with a mean of 71 and a standard deviation of 8.1. Find the numerical limits for a C grade. Round your answers to the nearest whole number, if necessary.

Hawkes Learning Chapter 8 Certification Chapter 8 Review Questions in Statistics

Qn1. direct mail company wishes to estimate the proportion of people on a large mailing list that will purchase a product. Suppose the true proportion is 0.07. If 402 are sampled, what is the probability that the sample proportion will be less than 0.04 ? Round your answer to four decimal places.

Qn2. Suppose a large shipment of laser printers contained 17% defectives. If a sample of size 224 is selected, what is the probability that the sample proportion will be greater than 16%? Round your answer to four decimal places.

Qn3. A carpet expert believes that 7% of Persian carpets are counterfeits. If the expert is accurate, what is the probability that the proportion of counterfeits in a sample of 574 Persian carpets would be less than 6%? Round your answer to four decimal places.

Qn4. The mean life of a television set is 138 months with a variance of 324. If a sample of 83 televisions is randomly selected, what is the probability that the sample mean would differ from the true mean by less than 5.4 months? Round your answer to four decimal places.

Qn5. A courier service company wishes to estimate the proportion of people in various states that will use its services. Suppose the true proportion is 0.07. If 330 are sampled, what is the probability that the sample proportion will differ from the population proportion by greater than 0.03? Round your answer to four decimal places.

Qn6 . If 330 are sampled, what is the probability that the sample proportion will differ from the population proportion by greater than 0.03? Round your answer to four decimal places.

Qn6. Suppose babies born in a large hospital have a mean weight of 3225 grams, and a standard deviation of 535 grams. If 106 babies are sampled at random from the hospital, what is the probability that the mean weight of the sample babies would differ from the population mean by more than 53 grams? Round your answer to four decimal places.

Qn7. Suppose 55% of the population has a college degree. If a random sample of size 496 is selected, what is the probability that the proportion of persons with a college degree will differ from the population proportion by less than 4%? Round your answer to four decimal places.

Qn8. The mean points obtained in an aptitude examination is 183 points with a standard deviation of 13 points. What is the probability that the mean of the sample would be greater than 186.2 points if 73 exams are sampled? Round your answer to four decimal places.

Qn9. Suppose cattle in a large herd have a mean weight of 1158lbs and a standard deviation of 92lbs. What is the probability that the mean weight of the sample of cows would be less than 1149lbs if 55 cows are sampled at random from the herd? Round your answer to four decimal places.

Qn10. Thompson and Thompson is a steel bolts manufacturing company. Their current steel bolts have a mean diameter of 135 millimeters, and a variance of 64. If a random sample of 32 steel bolts is selected, what is the probability that the sample mean would be less than 133 millimeters? Round your answer to four decimal places.