Posts tagged with inferential statistics help

Understanding Oneway Designs

Qn1. The issue that requires an experimenter to use a oneway ANOVA instead of a t-test is when there are more than two response categories available.

-True
-False

Qn2. Which of the following is the equivalent nonparametric analysis to a parametric oneway ANOVA?

-F-test
-t-test
-Kruskal-Wallis test
-Mann-Whitney U test
None of the above

Qn3. Typically, an ANOVA uses which distribution and test statistic?

-F
-t
-Chi-square
-Kolmogorov-Smirnov
-Poisson

Qn4. If an omnibus oneway ANOVA for a three-level factor is statistically significant, it does not mean that post hoc pairwise comparisons are allowed.

-True
-False

Qn5. Which of the following is the most proper way to report an F-test result?

-F(14) = 9.07, p = 0.009
-F(14) = 9.06, p < 0.01
-F(1,14)=  9.09, p = 0.009
-F(1,14) = 9.06, p < .01

-None of the above

Qn6. A oneway ANOVA is characterized by which experimental design?

-An Experiment with a single between-subject factor of exactly two levels.
-An experiment with a single between-subjects factor of two to more levels.
-An experiment with a single within-subjects factor of exactly two levels.
 -An experiment with a single within-subjects factor of two or more levels.
-None of the above


Submission
In your submitted report, you should address the research questions (shaded yellow below) by
reporting the analyses you are required to carry out (in italics below). To present your analyses and
conclusions you should write a detailed results section and a concise discussion section, using the
same format that would be expected in a journal article (i.e., APA style). There is a 1500-word
limit for this assignment. Independent of the word limit, you may include a maximum of five
tables and/or figures. References are not required but can be included to justify specific analytic
decisions (these will not be included in the word count).
Data  set
These data come from a study of healthy adults that included both questionnaires and cognitive
tasks. The accompanying text file is structured as follows:
Column 1 = participant ID number
Column 2 = delusional ideation (questionnaire range: 1-30; higher scores reflect greater lifetime
delusional ideation)
Column 3 = hallucination history (questionnaire range: 1-30; higher scores reflect greater lifetime
history of hallucinatory experiences)
Column 4 = pathology severity (questionnaire range: 10-100; higher scores reflect greater
psychopathology)
Column 5 = metacognition 1: perception (%; lower scores reflect poorer ability to think about one’s
perceptual states)
Column 6 = metacognition 2: memory (%; lower scores reflect poorer ability to think about one’s
memory)
Column 7 = source monitoring 1: speak vs. hear (%; higher values reflect poorer source
monitoring)
Column 8 = source monitoring 2: imagine vs. hear (%; higher values reflect poorer source
monitoring)
Input the data into SPSS to perform the subsequent analyses.
Research  questions
A team of researchers asked 180 healthy adults to complete the aforementioned set of questionnaires and cognitive tasks. The researchers were primarily interested in the cognitive variables that relate to the tendency to experience delusions and hallucinations. In addition to these two outcome measures, the other variables included a self-report scale of general psychopathology and measures of metacognition and source monitoring. In the metacognition tasks, participants had to complete a standard visual episodic memory or perception task and estimate their own performance.

The researchers sought to relate participants’ performance and their estimates of performance and thus created an outcome measure reflecting the percentage (%) correspondence between the two (higher % reflects greater correspondence or metacognition). The final two tasks measured source monitoring. In these tasks, participants had to perform one of two activities when presented with a word on a computer monitor (task 1: speak the word or listen to someone else speaking it; task 2: imagine the word being spoken or listen to someone else speaking it).

Afterwards, they were presented with a list of words and had to judge whether the word had been
spoken or heard (task 1) or imagined or heard (task 2). The researchers computed the percentage of
errors in these two tasks. All the individual data have been screened and cleaned so that there are
no missing data or miscodings; all data are normally distributed with no univariate or multivariate
outliers.

The researchers’ first question was whether they could predict delusional ideation and hallucination
history from the two measures of metacognition, two measures of source monitoring, and the single
measure of pathology severity. Carry out an analysis, or series of analyses, which will allow the
researchers to determine the answer to their first question. Briefly address whether the sample size
is suitable for this analysis (these analyses) and whether the data meet other assumptions of this
analysis (these analyses).

The researchers’ second question was motivated by the primacy of certain variables. In particular,
the authors thought that metacognition pertaining to perceptual states was more fundamental to
experiencing hallucinations than metacognition pertaining to memory. They similarly thought that
source monitoring pertaining to imagined vs. heard stimuli was more fundamental to experiencing
hallucinations than source monitoring pertaining to spoken vs. heard stimuli. Carry out an analysis,
or series of analyses, that would allow the researchers to incorporate their beliefs about the tasks
and allow them to understand the variables that predict hallucination experience.

The researchers’ third question concerned how source monitoring and metacognition relate to one
another in the prediction of hallucination experience. In particular, the researchers theorized that
metacognition for perception may underlie the relationship between source monitoring (imagined
vs. real) and hallucination history and thus that once you control for metacognition, the latter
relationship would reduce or disappear. Carry out an analysis, or series of analyses, which will
allow the researchers to determine the answer to this question.

If you need help with this assignment, then do not hesitate to contact us. Our writing experts can provide you with sample solutions for this assignment so that you can compare them with what you are working on.

ORDER THIS ASSIGNMENT
Please determine the best analytical method for each of the 8 questions below and conduct the appropriate analysis. Write up the analysis for each and submit on Canvas

Inferential statistics questions

Qn1. A school psychologist would like to test the effectiveness of a behavior-modification technique in controlling classroom outbursts. Every time a child has an outburst, then ten minutes of free time is taken away. Four children were followed for six months and numbers of outbursts were recorded before treatment and then six months after treatment. The psychologist wants to see if there is a decline in outbursts over time. Test the null hypothesis that there is no difference in outbursts. Use a .05 alpha level.

  1. An education statistics professor wants to see if her class has a similar average GRE quantitative score as the national average of 500. The class members have the following scores. Use an alpha level of .05.
    Class GRE Quant Scores
    450.00
    550.00
    525.00
    500.00
    425.00
    400.00
    515.00
    520.00
    500.00
    480.00
    490.00
    510.00
    650.00
    600.00
    400.00
    425.00
    620.00
    500.00

Hypotheses
H0: µ = 500
Ha: µ ≠ 500

  1. A soccer coach conducts a keeper clinic over the summer. She uses two different techniques to train – one for morning session children (n=13) and one for afternoon session children (n=13). She records the number of saves made by keepers at an end-of-summer drill. She wants to see if there was a difference in number of saves by keepers in the morning sessions and afternoon sessions, thereby indicating that one method would be better than the other. Use a .05 alpha level.

Qn4. A professor gives a standardized achievement test to students after going through a course in sociology. She wants to see if her students scored similarly to the national average of sociology students on the test. The population of first year sociology students has an average score of 170 on the test. Use an alpha level of .05 and determine if there is a difference between her students’ scores and the population mean.

Qn5. An English teacher wants to see if composition scores for three classes in her school are similar or different. She suspects that there are teacher differences in how composition is taught. At the end of the semester she collects scores from a standard composition test from students in each class. She has a teacher from another school score the tests, and then she takes a random sample of the scores. The scores for each class are listed below. Test the null hypothesis that there is no difference in scores. Use an alpha level of .05.

Qn6. A study on the reaction time of children with cerebral palsy reports a mean of 1.6 seconds on a particular task. A research believes that the reaction time can be reduced by using a motivating set of directions. Twelve children were given the motivating set of directions and their reaction times are recorded. A separate sample of twelve children was given no motivating directions, and completed the same task. Test if there is a difference between tes sample with motivating directions and the one without motivating directions. Use an alpha of .05.

Qn7. A method to improve math achievement was tested by an elementary school teacher. Students were given a math pretest then given the particular math tutoring. After tutoring, a post test was given. Test if there is a difference between pre and post math scores. Use alpha of .05.

Qn8. An educational psychologist designs a research study to investigate different problem-solving strategies. Subjects are randomly assigned to one of five different groups. Each group is taught to use a different problem-solving strategy. After the training, each subject is given a series of problems to solve using the various strategies. The data below are times each subject spent solving the problems. Test the hypothesis that there is no difference among groups in terms of time spend solving a problem. Use and alpha of .05.

Statistics homework help

The file containing the data for each question is attached here for your reference, and if you'd like help with this assignment, then do not cease to contact us. Note that we also have solutions for this assignment ready,statistics homework 3.docx which you can purchase to compare with your analysis.

order statistics homework

Hypothesis testing questions.
Question 1
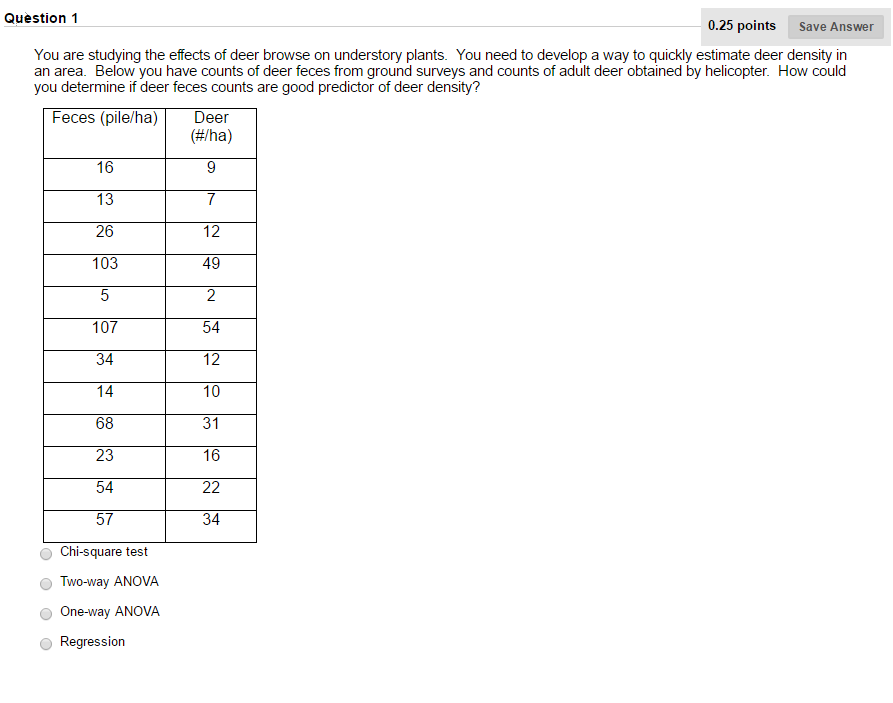
You are studying the effects of deer browse on understory plants. You need to develop a way to quickly estimate deer density in an area. Below you have counts of deer feces from ground surveys and counts of adult deer obtained by helicopter. How could you determine if deer feces are a good predictor of deer density?
deer.png
anova.png

question 3.png