mathexpert published posts

MyMathLab Homework Answers

Qn 21.
Use the Standard Normal Table or technology to find the z-score that corresponds to the cumulative area 0.9023
Qn22.

Find the z-score that has 48.4% of the distribution’s area to its left.
Qn23.
The weights of bags of baby carrots are normally distributed, with a mean of 34 ounces and a standard deviation of 0.37 ounce. Bags in the upper 4.5% are too heavy and must be repackaged. What is the most a bag of baby carrots can weight and not need to be repackaged?
A bag of baby carrots can weight at most ounces without needing to be repackaged.

Hint: Find the z-score that corresponds to a certain area by locating
that area in the Standard Normal Table. The values at the beginning of
the corresponding row and at the top of the corresponding column give
the z-score. In most cases, the area will not be an entry in the
table. In these cases, use the entry closest to it. When the area is
halfway between two area entries, use the z-score halfway between the
corresponding z-scores. Technology can also be used to find the
z-score. To transform a standard z-sc0re to an x-value in a given
population, use the formula x = u = zsigma, where u is the population
mean and sigma is the population standard deviation.

Qn24.
A population has a mean mu = 84 and a standard deviation sigma = 16. Find the mean and standard deviation of a sampling distribution of a sample means with sample size n = 64.
2.- Assignment M3

This week we will be learning about Bias. Your PowerPoint notes have the essential material and the textbook can help elaborate. This is the first week you will have a data analysis project due. The dataset you need is posted in the materials folder so you should download it from BB and open it with SPSS. I have included screenshots in the PowerPoint notes and your book goes step by step. Remember that there are multiple ways to get the same answer, so as long as you understand the purpose of the test or task, the means to the end may vary. The write-up example I have provided is already formatted and presented in the way I would like to have you turn yours in. This example is in the 6th Edition of APA - please use the 7th format as your style.

M3: Use dataset provided to conduct tests of normality including skew, kurtosis, and Levene’s test. Interpret results and explain findings. See powerpoint notes for help with these tests. Lastly, formulate solutions to any problems with the data. (Docs attached)

Using the Notebook.sav data, check the assumptions of normality and homogeneity of variance for the two films (ignore sex). Are the assumptions met?

Qn18 Find the indicated probability using the standard normal distribution
P(-1.16 < z < 1.16)
Qn19. Assume the random variable x is normally distributed with mean mu = 50 and standard deviation sigma = 7. Find the indicated probability.
P(x > 43)
Qn20. Use the normal distribution of SAT critical reading scores for which the mean is 514 and the standard deviation is 121. Assume the variable x is normally distribted.
a. What percentage of the SAT verbal scores are less than 550?
b. If 1000 SAT verbal scores are randomly selected, about how many would you expect to be greater than 525?

Using normal and Binomial distribution tables

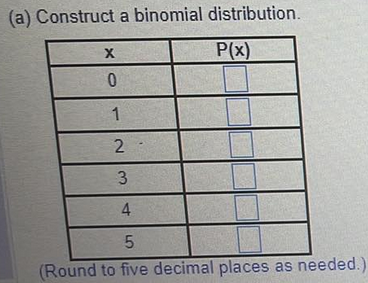
Qn14. Seventy-six percent of adults want to live to age 100. You randomly select five adults and ask them whether they want to live to age 100. The random variable represents the number of adults who want to live to age 100. Complete parts (a) through (c) below.
probability distribution table.png

Graph the binomial distribution using a histogram and describe its shape.

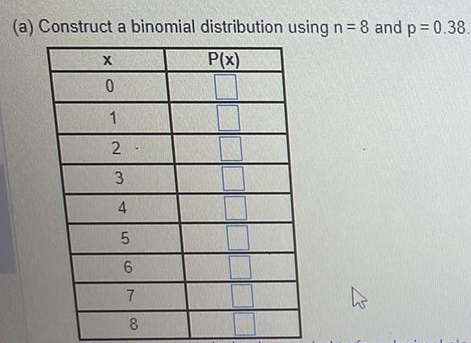
Qn15. 38% of employees judge their peers by the cleanliness of their workspaces. You randomly select 8 employees and ask them whether they judge their peers by the cleanliness of their workspaces. The random variable represents the number of employees who judge their peers by the cleanliness of their workspaces. Complete parts a through c below.

binomial table.png

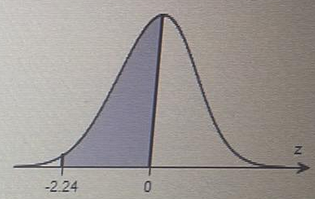
Qn16. Find the area of the shaded region under the normal curve. If convenient, use technology to find the area.
standard normal distribution table.png

Qn17. A standardized exam’s scores are normally distributed. In a recent year, the mean test score was 20.8 and the standard deviation was 5.6. The test scores of four students selected at random are 13,23,9, and 36. Find the z-scores that correspond to each value and determine whether any of the values are unusual.

Qn11. Determine whether the random variable X is discrete or continuous. Explain.
Let x represent the amount of rain in City B during April.
random variable table.png
Qn12. Find the mean variance, and standard deviation of the binomial distribution with the given values of n and p.
Qn13. Complete parts (a) and (b) below.
The number of dogs per household in a small town
number of dogs per household.png
Find the mean, variance, and standard deviation of the probability distribution.