Seventy-six percent of adults want to live to age 100
Using normal and Binomial distribution tables
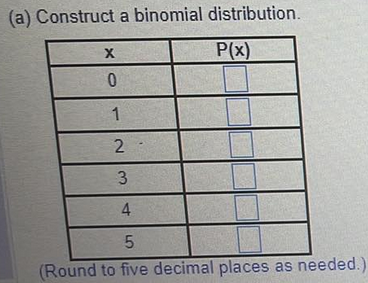
Qn14. Seventy-six percent of adults want to live to age 100. You randomly select five adults and ask them whether they want to live to age 100. The random variable represents the number of adults who want to live to age 100. Complete parts (a) through (c) below. 
Graph the binomial distribution using a histogram and describe its shape.
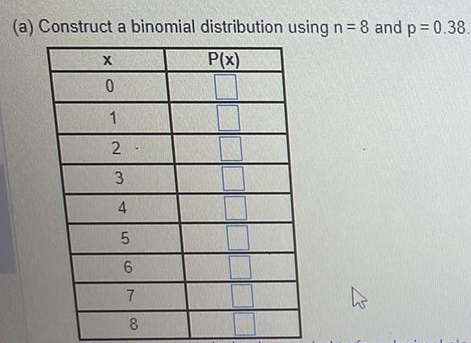
Qn15. 38% of employees judge their peers by the cleanliness of their workspaces. You randomly select 8 employees and ask them whether they judge their peers by the cleanliness of their workspaces. The random variable represents the number of employees who judge their peers by the cleanliness of their workspaces. Complete parts a through c below.

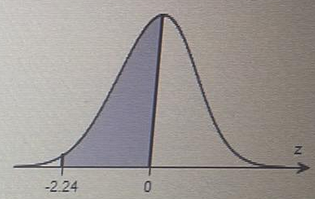
Qn16. Find the area of the shaded region under the normal curve. If convenient, use technology to find the area. 
Qn17. A standardized exam’s scores are normally distributed. In a recent year, the mean test score was 20.8 and the standard deviation was 5.6. The test scores of four students selected at random are 13,23,9, and 36. Find the z-scores that correspond to each value and determine whether any of the values are unusual.