Posts under category Hypothesis testing help

Planned comparisons between domestic and international bookings

Qn11. Download the file bookflights.csv from the course materials. This file describes a survey in which website visitors books a flight on either Expedia, Orbitz, or Priceline. Whether they booed a domestic or international flight was recorded. The survey response was 1-7 rating for Ease on a Likert-type scale, with “7” being easiest. The research question is which site felt easiest to use overall, and specifically for domestic vs. international bookings. How many subjects took part in this study?

Qn12. Create an interaction plot with Website on the X-axis and International as the traces. How many times, if ay, do the two traces cross? Hint: if you already recoded Ease as an ordinal response, you must use as.numeric when passing it to interaction.plot.

Qn13. Use ordinal logistic regression to examine Ease by Website and International. To the nearest ten-thousandth (four digits), what is the p-value of the website main effect? Hint: Use the MASS library and its polr function with Hess = TRUE to create the ornidal logistic model. Then use the car library and its Anova function with type = 3. Prior to either, set sum-to-zero contrasts for both website and international.

Qn14. Conduct three planned comparisons between domestic and international bookings for each website. Adjust for multiple comparisons using Holm’s sequential Bonferroni procedure. What is the highest p-value from such tests? Hint: use the multcomp and lsmeans libraries and the lsmeans, pairs, and as.glht functions. (The lsm formulation from within glht will not work in this case.) Because we only have three planned pairwise comparisons, use “none” for the multiple comparisons adjustment to avoid correcting for all possible pairwise comparisons. Instead, just find the three planned and as-yet uncorrected p-values and pass them manually to p.adjust with method=”holm”. Since the formulation for simultaneous comparisons is a bit different, we place the code for those aspects of this questions here:

Summary(glht(m,lsm(pairwise ~ website * International)), test = adjusted (type = “non”)) 

Qn15. Which of the following conclusions are supported by the analyses we performed on bookflights.csv?

There was a significant main effect of website on Ease
There was a significant main effect of International on Ease
There was significant website*international interaction
Expedia was perceived as significantly easier for booking international flights than domestic
Orbitz was perceived as significantly easier for booking domestic flights than international flights
Priceline was perceived as significantly easier for booking domestic flights than interanion flights.
Doing Factorial ANOVAs

Qn20. Download the file socialvalue.csv from the course materials. This file describes a study of people viewing a positive or negative film clip before going onto social media and then judging the value of the first 100 posts they see there. The number of valued posts was recorded. Examine the data and indicate what kind of experiment design this was.

- A 2x2 between-subjects design with factors for clip (positive, negative) and social (Facebook, Twitter).
-A 2x2 within-subjects design with factors for clip(positive, negative) and social (facebook, Twitter).
-A 2x2 mixed factorial design with a between-subjects factor for clip (positive, negative) and a within-subjects factor for social (Facebook, Twitter).
- None of the above

Qn21. How many subjects took part in this experiment?
Qn22. To the nearest hundredth (two digits), on average how many posts out of 100 were valued for the most combination of clip and social?

Qn23. Create an interaction plot with social on the X-axis and clip as the traces. Do the lines cross?

Yes
No

Qn24. Create an interaction plot with clip on the X-axis and social as the traces. Do the lines cross?

Yes
No

Qn25. Conduct a factorial ANOVA to test for any order effects that the presentation order of the clip factor and/or the social factor may have had. To the nearest ten-thousandth (four digits), what is the p-value for the ClipOrder main effect? Hint: Use the ez library and its ezANOVA function. Pass both ClipOrder and Socialorder as the within parameter using a vector created with the “c” function.

Qn26. Conduct a factorial ANOVA on valued by clip and social. To the nearest hundredth (two digits), what is the largest F statistic produced by such a test? Hint: use the ez library and its function. Pass both clip and social as the within parameter using a vector created with the “c” function.

Qn27. Conduct two planned pairwise comparison using paired-samples t-tests. The first question is whether on Facebook, the number of valued posts was different after people saw a positive fil clip versus a negative film clip. The second question is whether on Twitter, the number of valued posts was different after people saw a positive film clip versus a negative film clip. Assuming equal variances and using Holm’s sequential Bonferroni procedure to correct for multiple comparisons, what to within a ten-thousandth (four digits) is the lowest p-value from these tests? Hint: use the reshape2 library and its dcast function to make a wide-format table with columns for subject and the combination of social* clip, and then do a paired-samples t-test between columns with the same social level.

Qn28. Which of the following conclusions are supported by the planned pairwise comparisons just conducted? (Mark all that apply)

On Facebook, people valued significantly more posts after seeing a positive film clip than a negative film clip
On Facebook, people valued significantly more posts after seeing a negative film clip than a positive film clip.
On Twitter, people valued significantly more posts after seeing a positive film clip than a negative film clip,
On Twitter, people valued significantly more posts after seeing a negative film clip than a positive film clip.

Qn29. Continue using the file socialvalue.csv from the course materials. Conduct a nonparametric Aligned Rank Transform procedure on Valued by Clip and Social. To the nearest hundredth (two digits). What is the largest F statistic produced by this procedure?

Hint: use the ARTOOL library and its art function with the formula.
Valued ~ Clip * Social + (1|Subject)

The above formular expression indicates that subject is to be treated as a random effect.

Qn30. Pairwise comparisons among levels of clip and among levels of social could be conducted using the following code, but these are unnecessary after our main effects tests because each of these factors only has two levels.

*library(lsmeans)
lsmeans(artlm(m,”clip”), pairwise ~ Clip)
lsmenas(artlm(m, “social”), pairwise ~ social)*

True
False

Qn31. Conduct interaction contrasts (i.e difference-of-differences) to discover whether the difference in the number of valued posts after viewing a negative clip vs. a positive clip on Facebook was itself different that that same difference on Twitter. To the nearest hundredth (two digits), what is the chi-square statistic from such a test? Hint: use the phia library and its testInteractions function with the artlm function.

Qn32. The difference in the number of valued posts after people saw negative film clip vs positive film clips in the Facebook condition is significantly different from that difference in the Twitter condition. An interaction plot makes it clear that the difference in valued posts was much greater in the Facebook condition than in the Twitter condition, with positive film clips resulting in more valued posts.

Understanding Experiment Designs

  1. What might account for random error in an experimental measure?

    • natural variation among and within subjects
    • A systematic flaw in the logging software
    • A pattern of dropped data for every fifth subject
    • Biased observations
  2. Which of the following would be an ordinal response? (Mark all tha apply)

    • Responses on a Likert-type scale
    • Height in centimeters of each subject
    • Favorite color of each subject
    • How spicy each subject prefers their Thai food using 1-5 stars

      • The number of heads resulting from one-hundred coin flips
  3. In an experiment, factors are the independent variables manipulated by the experimenter, and level are the specific values a factor can take on.

    • True
    • False
  4. A between-subjects factor is most precisely defined by which of the following characteristic?

    • Each subject experiences more than one level of the factor
    • Each subject experiences only one level of the factor,
    • Each subject experiences all levels of the factor.
    • Each subject experiences all but one level of the factor.
    • None of the above
  5. A within-subjects factor is most precisely defined by which of the following characteristic?

    • Each subject experiences more than one level of the factor.
    • Each subject experiences only one level of the factor,
    • Each subject experiences all levels of the factor.
    • Each subject experiences all but one level of the factor.
    • None of the above
  6. If a given factor has four levels and subjects experience two of the four levels, that factor is most precisely described as:

    • A within-subjects factor
    • A between-subjects factor
    • A partial within-subjects factor
    • A partial between-subjects factor
    • None of the above
  7. Balanced experimental designs are where every subject experiences every level of every factor

    • True
    • False
  8. The most common use of an independent-samples t-test is to examine which of the following?

    • One set of subjects that all does the same thing
    • One set of subjects that does two different things
    • Two sets of subjects that do the exact same thing
    • Two sets of subjects that do different things
    • None of the above
  9. Which of the following is the most proper way to report a t-test result?

    • t(14) = 2.76. p = .015
    • t(14) = 2.76, p < .05
  10. A t-test is a test suited to one factor with two levels

    • True
    • False

PSY 223 Final Project Guidelines and Rubric

The final project for this course is the creation of a statistical analysis report. The two research courses (PSY 223 and PSY 224) will demystify statistics and research methods in order to show that they are based on simple principles that apply to situations in the social sciences. In psychology, we need to distinguish what is “real” from what is “not real but looks real.” Is this patient really depressed? Does this form of group treatment of adolescents work better than a different form of treatment?

In this summative assessment, you will choose a scenario from a given set to be the basis for your statistical analysis report. Within the scenario, you will be given a data set based on two groups. You will apply the statistical analysis skills you have learned in this course to interpret the data and write up a report of the results. You will be evaluated not only on your computations but also on your explanation of the interpretation of the data.

The project is divided into three milestones and a final product. The milestones will be submitted at various points throughout the course to scaffold learning and to ensure quality final submissions. These milestones will be submitted in Modules Two, Four, and Five. The final project will be submitted in Module
Seven.
In this assignment, you will demonstrate your mastery of the following course outcomes:

Analyze descriptive and inferential statistics for preparing statistically accurate psychological research
Utilize appropriate statistical techniques for computing descriptive statistics and generating graphs regarding statistical analyses of psychological research
Select appropriate statistical procedures for use in statistical analyses regarding psychological research
Interpret the results of statistical analyses of psychological research data for drawing informed conclusions regarding the implications of psychological research
Assess scenarios involving statistical procedures for ensuring alignment with the expectations of the APA Ethical Principles of Psychologists

Find the remaining section of the final paper instructions in the attachment.
1 psy223_final_project_guidelines_and_rubric.pdf

Hypothesis testing questions.
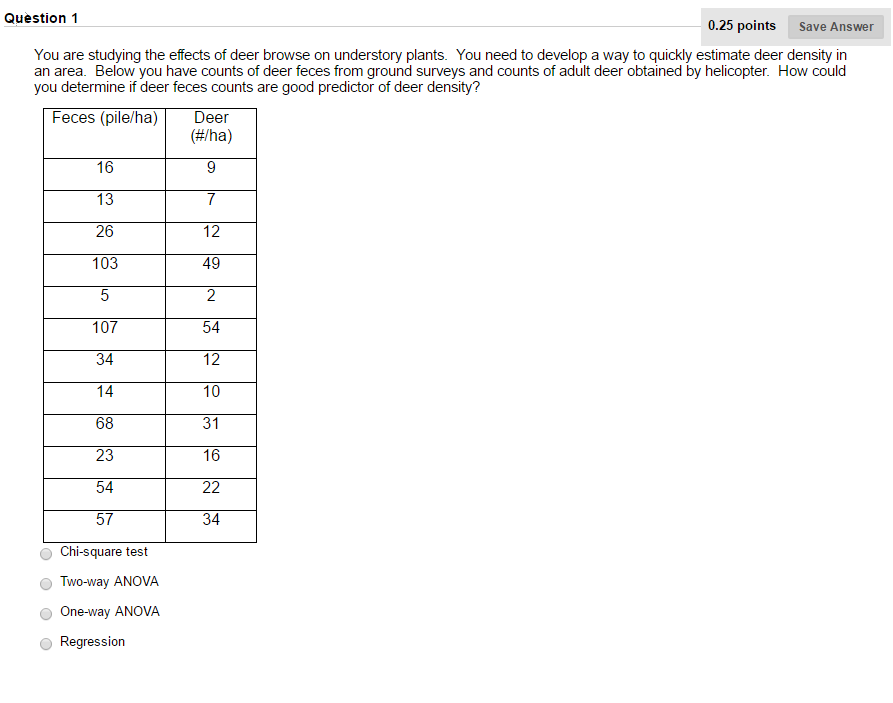
Question 1
You are studying the effects of deer browse on understory plants. You need to develop a way to quickly estimate deer density in an area. Below you have counts of deer feces from ground surveys and counts of adult deer obtained by helicopter. How could you determine if deer feces are a good predictor of deer density?
deer.png
anova.png

question 3.png